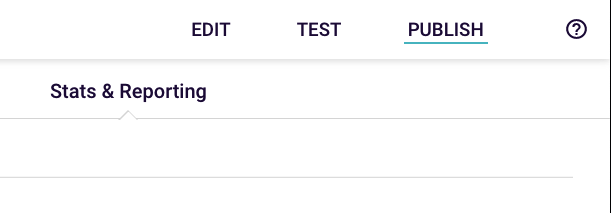
Figure 1: Where to find invocation statistics
You may have come across the following messages when running a query against a knowledge map:- “Unfortunately Rainbird has been unable to process the goal against the current Knowledge Map”.
- This indicates that a query has started but not finished.
- “Sorry, I’ve been unable to find an answer to your question!”
- This indicates that a query has finished but Rainbird was not able to produce a result.
Note: Invocation statistics will be deleted in line with any data retention settings that have been applied.
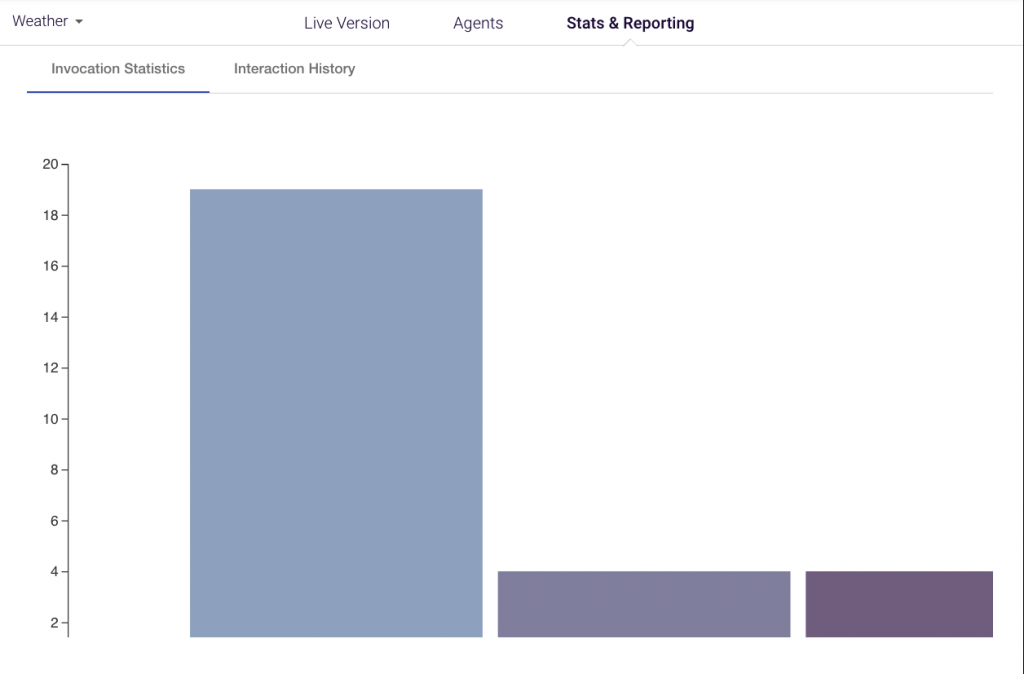
To differentiate between queries run by end users through an agent, and queries that a knowledge author has run through the query tab when building their map:
- Queries in the Test tab will always run against the draft version of a knowledge map.
- Queries run through any Agents or an API will use the version set to ‘Live’.
- If an agent has been created but there is no ‘Live’ version has been nominated, any stats which are displayed will correspond to queries that have been run against the draft version only.
Rainbird will create a new set of bars for each new date. The information provided through the bar charts from left to right show started queries (counts as soon as a query starts), finished queries (counts as soon as all answers have been asked) and answered queries (counts as soon as Rainbird can return a result). The answer query values will increase by one for every result if Rainbird returns multiple answers.
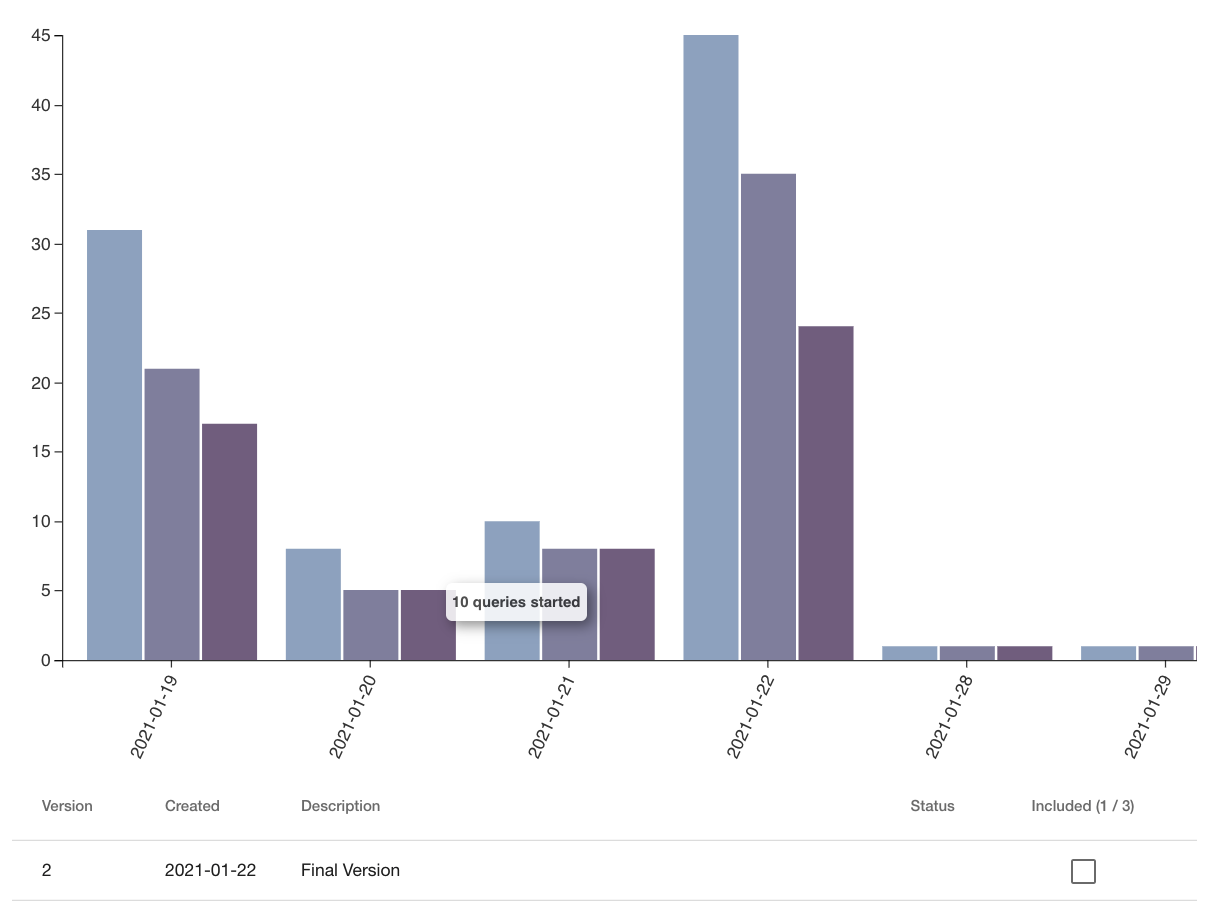
Figure 3: Bar charts across multiple dates
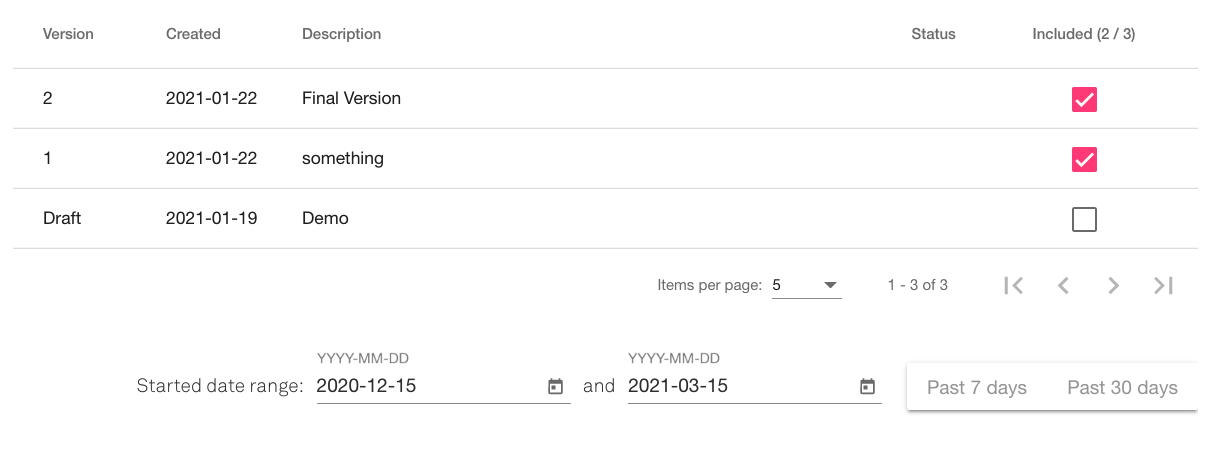
Figure 4: Invocation statistic filters
Note: If an agent has been created but no ‘Live’ version of the map has been nominated, any stats which are displayed will correspond to queries that have been run against the draft version only.